We all know how important it is to understand how your customers behave to succeed in ecommerce. Heatmap analysis is one effective approach that can provide priceless insights into how people interact with your website.
Heatmaps provide a visual depiction of user behavior by highlighting the sections of your website that get the most interest, where users click, and how far they scroll. Amazon was able to grab more than 70 % of conversion rates using heatmaps.
So, why not your business?
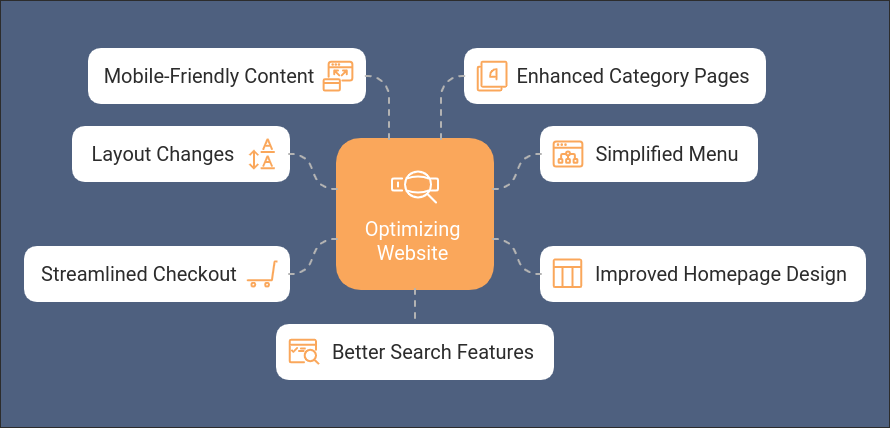
You can enhance user experience, increase conversions, and optimize your e-commerce site by using heatmap data. We’ll look at seven simple methods on how to use heatmap to improve the performance of your online business.
Steps on Optimizing and How to Use Heatmap
1. Make Layout Changes to Your Product Page
Your product pages convert visitors into purchasers, meaning that for every 20 visitors, one person makes a purchase, effectively turning website traffic into paying customers. Heatmaps can help you optimize the layout of these important pages for maximum effect by showing how people interact with them.
Utilizing heatmaps:
- Examine click heatmaps to determine which components people are most likely to engage with.
- To learn how far down a page people usually scroll, look at scroll maps.
- To see which parts of the page get the most attention, use attention heatmaps.
Optimization pointers:
- Put the components that will affect the greatest interaction, such as “Add to Cart” buttons, in high-traffic regions.
- Rearrange page components such that calls to action or important features are highlighted for visitors.
- Consider putting crucial information, such as delivery information or customer reviews, higher up on your product pages. Consumers often don’t scroll past the halfway point of a webpage. In fact, studies show that nearly 70% of users never make it past the first screen of content.
2. Simplify Your Menu for Navigation
An easy-to-navigate menu helps visitors quickly find what they’re searching for. Using heatmaps, you can see which menu items are popular and which ones people may miss.
Utilizing heatmaps:
- Examine the click heatmaps of your menu on various pages.
- Observe user behavior trends when it comes to drop-down or mega menus.
Optimization pointers:
- Give priority to menu items that are regularly clicked by making them stand out.
- Consider grouping or eliminating seldom-used menu items.
- Try arranging and rearranging menu categories according to how users interact with them.
You can see how our development team designed the navigation section for one of our clients in the below image:
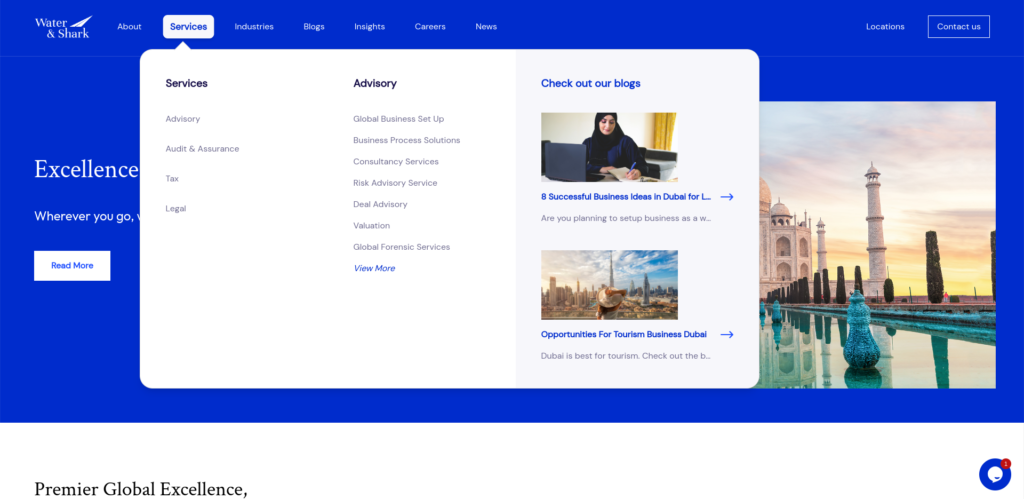
If your heatmaps show that users seldom click on specific categories in your menu, you may want to reconsider their relevance or look for methods to improve their appearance. On the other hand, you can consider creating subcategories inside a really popular category to make it simpler to navigate.
3. Improve the Design of Your Homepage
Customers often build their initial opinion of your online shop based on your homepage. As per Forbes 94% of first impressions are design-related. You should know how to use heatmap to create a homepage that directs users to the most relevant areas of your website.
Utilizing heatmaps:
- Study your homepage’s click and attention heatmaps to determine which sections get the most visitors.
- To find out how much of your homepage content is really being seen, use scroll maps.
Optimization pointers:
- Put your most significant deals or promotions in places where people will notice them.
- A crucial call to action should be placed in areas where there is a lot of click activity.
- If the content isn’t drawing attention, remove it or relocate it to a lower position on the page.
Here is one more example of our client. You can see how there is a section for customer reviews with video which adds so much credibility to their services.
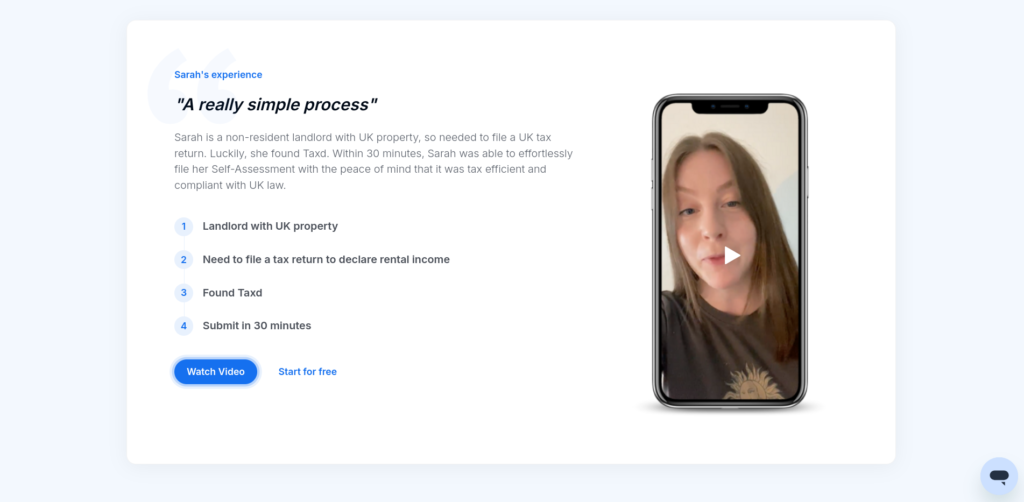
If your heatmap shows that users are drawn to a specific banner or product category, consider using similar design features in other parts of your site or expanding that content. If users aren’t scrolling far enough to see important information, try adjusting the layout to place it higher on the page so it’s immediately visible.
4. Streamline the Checkout Procedure
Efficient and user-friendly checkout procedures are very important to reduce cart abandonment and boost conversions. Reducing checkout steps to three or fewer can increase conversions by up to 20%. Heatmaps can be used to identify possible areas of friction in your checkout process.
Utilizing heatmaps:
- Check click heatmaps at every stage of the checkout process.
- Look for places where users could be experiencing confusion or stuckness.
Optimization pointers:
- Remove fields from forms that users often overlook or find difficult to complete.
- Important buttons (such as “Proceed to Payment”) should be placed where they are simple to click.
- Position brief explanations or hints near areas where users may hesitate so they have quick guidance if needed.
If your heatmaps reveal that users are clicking on non-clickable items throughout the checkout process, it is a sign of confusion. To make certain items more intuitive, you can redesign them or add tooltips. Similarly, if users are ignoring optional fields, think about eliminating them to make the process go more smoothly.
5. Make Your Content Mobile-Friendly
Because more customers are making purchases from mobile devices, you need to ensure an excellent mobile experience. Over 60% of website traffic originates from mobile devices. Heatmaps can show you how mobile and desktop visitors engage with your website differently.
Utilizing heatmaps:
- For important sites, compare the heatmaps on mobile and desktop devices.
- On mobile devices, be mindful of the touch positions and scroll depth.
Optimization pointers:
- On smaller displays, make sure components that are tapped often are readily accessible.
- Prioritize the content that mobile visitors interact with the most by adjusting the layout.
- Adjust button positions and sizes to best accommodate touch inputs.
For instance, if mobile heatmaps show that users hardly scroll beyond a certain point, you need to reduce the amount of text on your page or use more visually appealing images to entice people to explore further. Large, clear product images are considered more important by 50% of online shoppers than reading product descriptions or reviews. You may also need to enlarge or space out any items that are regularly misclicked on mobile.
6. Make Your Category Pages Better
Category pages are essential for assisting clients in finding the items they want. Heatmaps can help you arrange these pages for the best user experience.
Utilizing heatmaps:
- Check and click heatmaps to find out which products and services consumers are most likely to engage with.
- To find out how many goods a person usually views before leaving a page, utilize scroll maps.
Optimization pointers:
- Show products based on average scroll depth so users see the right amount.
- Place popular filters where they’re easy to access.
- Add commonly used filters to the main menu or make them more visible.
7. Improve The Search Features
A search tool can help customers locate things more quickly and have a far better user experience.
Utilizing heatmaps:
- See the click heatmaps around your search bar and the sites that show results.
- Observe how people use tools like autocomplete or search recommendations.
Optimization pointers:
- If heatmaps reveal that your search bar isn’t being used often, make it more noticeable.
- Enhance search recommendations by using phrases that are commonly clicked.
How to Create a Heatmap
Here are steps on how to create a heatmap:
1. Choose Heatmap Tool
Choose a heatmap tool first. Hotjar, Crazy Egg, and Lucky Orange are popular. Consider cost, functionality, usability, and tech stack integration. Many of these tools offer free trials, so you can try them before buying.
2. Install Tracking Code
After selecting your tool, you must put its tracking code on your website. This generally involves adding a JavaScript snippet to your header. Most heatmap tools provide explicit instructions, and WordPress plugins can simplify this procedure.
3. Track Pages
Select pages to analyze. For your ecommerce site, start with your homepage, essential landing pages, or product pages.
4. Heatmap Configuration
Create a heatmap on your tool’s dashboard. Choose which pages to monitor and for how long. For statistical significance, aim for 1,000 pageviews.
5. Select Heatmap Types
Most tools provide numerous heatmap types:
- Click heatmaps: Display user clicks/taps
- Move heatmaps: Show mouse movements
- Scroll heatmaps: Show how far people scroll down.
Choose kinds that match your analysis aims.
6. Collect and Analyze Data
Collect data for the chosen time using your heatmap. Once you have enough data, analyze it. Look for patterns like:
- High-click areas
- Rarely visited page sections
- Items users encounter unexpectedly
Use these insights to change layouts, relocate key pieces, or remove distractions on your website.
Bottom Line
Heatmaps are an excellent resource for learning about user behavior on your e-commerce website. These seven ways to gain insightful knowledge about consumer behavior can optimize your online business. Review your e-commerce heatmap on a regular basis and make small adjustments in response to the information you collect.
With the help of Rankfast, you can design an online store that really caters to your tastes.
FAQs
1. What is a heatmap precisely, and how does an e-commerce site use one?
A heatmap is a color-based visual representation of user interaction data on your website. In terms of e-commerce, it displays the user’s mouse pointer, scroll distance, and click locations. “Cool” colors (blue, green) denote little activity, whereas “hot” colors (orange, red) suggest places with considerable activity. There are three types of heatmaps: scroll, move, and click.
2. How often should I examine my e-commerce site’s heat maps?
The traffic and modifications to your website determine the frequency. Analyze new or rebuilt websites once or twice a week. Established sites might conduct monthly or quarterly evaluations. Analyze if there have been significant changes or at busy times. Consistent, recurring evaluation is the aim—but not too much.
3. Can heatmaps support my e-commerce site’s A/B testing?
Yes, heatmaps are useful for A/B testing. Displaying low-interaction zones helps identify testable areas. Heatmaps after testing show interaction differences, which can explain why one version performed better than another. They also provide suggestions for fresh tests based on effective components. For a thorough overview of your tests, combine heatmaps with additional data, such as conversion rates. They supplement numerical data with visual insights into user behavior.
4. When using heatmaps, are there any privacy risks I should be aware of?
Absolutely; keep privacy in mind while utilizing heatmaps. Make sure no personal information is being collected by your tool. Get user permission, particularly to comply with GDPR. Heatmaps should not be used on delicate sites like the checkout. Look into your provider’s data storage policies. Keep staff meetings out to concentrate on client behavior. To be sure that heatmap tools are complying with applicable privacy regulations in your country, review their privacy policies and speak with legal experts.
Leave a Reply