
According to eMarketer, by 2027, US retail ecommerce sales will reach $1.720 trillion.
Ecommerce businesses collect a lot of data about their customers and operations. Successful companies use this data to understand how well they are performing. However, this information is sometimes stored separately, making it difficult to see the overall picture and fully benefit from it.
The ecommerce metrics provide valuable insights into your online store’s performance to make smart decisions and improvements. Find the key ecommerce metrics to track in 2024 and help businesses identify their strengths and weaknesses.
Ecommerce Metrics to Track in 2024
Following is a list of 20 ecommerce metrics to track the performance of your website.
1. Conversion Rate
The conversion rate is one of the important ecommerce metrics to track. This indicator shows the proportion of visitors that take a desired action on your website, which is often a purchase. A strong conversion rate suggests that your website is efficiently converting visitors into customers.
Calculation: (Number of conversions / Total number of visits) * 100

Tablets lead eCommerce conversions at 3.1%, followed by desktops at 2.8%, and smartphones close behind at 2.3%. The overall average is 2.5%.
To increase your conversion rates:
- Optimize your product pages by providing informative descriptions and high-quality photos.
- Simplify your checkout procedure.
- Implement trust signals such as customer feedback and security badges.
- Implement targeted advertisements and individualized suggestions.
2. Average Order Value (AOV)
AOV shows how much a typical client spends on each transaction. Increasing this measure can increase your income without necessarily growing traffic.
Calculation: Total income/number of orders
To raise the AOV:
- Offer goods bundles or packages.
- Implement cross-selling and upselling methods.
- Offer free shipping criteria.
- Create loyalty programs that encourage greater purchases.
3. Customer Acquisition Costs (CAC)
CAC estimates the cost of acquiring a new client. This indicator determines the effectiveness of your marketing strategies and maintaining profitability.
Calculation: Total marketing costs/number of new clients obtained
To maximize the CAC:
- Refine your target audience to increase ad efficiency.
- Invest in content marketing and SEO to achieve long-term organic growth.
- Use consumer recommendations and word-of-mouth marketing.
- Consistently test and optimize your marketing tactics.
4. Customer Lifetime Value (CLV)
CLV predicts the total income a company can expect to generate from a single client account throughout its partnership. This helps you determine how much you can afford to spend on client acquisition and retention.
Calculation: (Average order value x average number of purchases per year x average customer lifetime)
To enhance the CLV:
- Focus on client retention by providing exceptional service and support.
- Create a solid email marketing plan.
- Provide tailored experiences and suggestions.
- Create a loyalty program to promote repeat purchases.
5. Cart Abandonment Rate
This ecommerce metric displays the proportion of customers that add products to their basket but leave without making a purchase. A high cart abandonment rate can indicate issues with your checkout process or pricing strategy.
Calculation: (Number of abandoned carts / Number of initiated carts) * 100

To minimize cart abandonment:
- Simplify your checkout procedure.
- Provide guest checkout alternatives.
- Offer numerous payment ways.
- Send cart abandonment emails, including incentives for finishing the transaction.
6. Return on Advertising Spend (ROAS)
ROAS assesses the efficacy of your digital advertising initiatives by comparing income earned to ad spend.
Calculation: Ad revenue divided by ad cost
To enhance the ROAS:
- Optimize audience targeting and A/B test ad creatives and text.
- Optimize landing pages for conversion.
- Concentrate on top-performing channels and campaigns.
7.Net Promoter Scores (NPS)
NPS ecommerce metrics measure customer loyalty and satisfaction by asking them how likely they are to recommend your brand to others. This indicator can help in predicting future growth and highlight areas for improvement in the customer experience.
Calculation: % of promoters – % of detractors
To enhance the NPS:
- Respond to client comments swiftly.
- Offer great client service.
- Continuously enhance product quality and variety.
- Develop tailored experiences for consumers.
8. Website Traffic
While not a direct sign of revenue, website traffic is an important measure that reflects broad interest in your brand and goods. Tracking traffic sources can help you determine which marketing tactics are the most successful.
Key traffic metrics to monitor:
- Unique visitors and page views
- Traffic sources (organic, paid, social, referral, and so forth)
- New versus returning visitors.
To boost online traffic:
- Invest in SEO and content marketing.
- Utilize social media networks.
- Run tailored advertising efforts.
- Collaborate with influencers and industry partners.
9. Bounce Rate
The bounce rate is the proportion of visitors who abandon your website after seeing just one page. A high bounce rate might suggest problems with the site’s design, content relevancy, or usability.
Calculation: (Number of single-page sessions / Total number of sessions) * 100
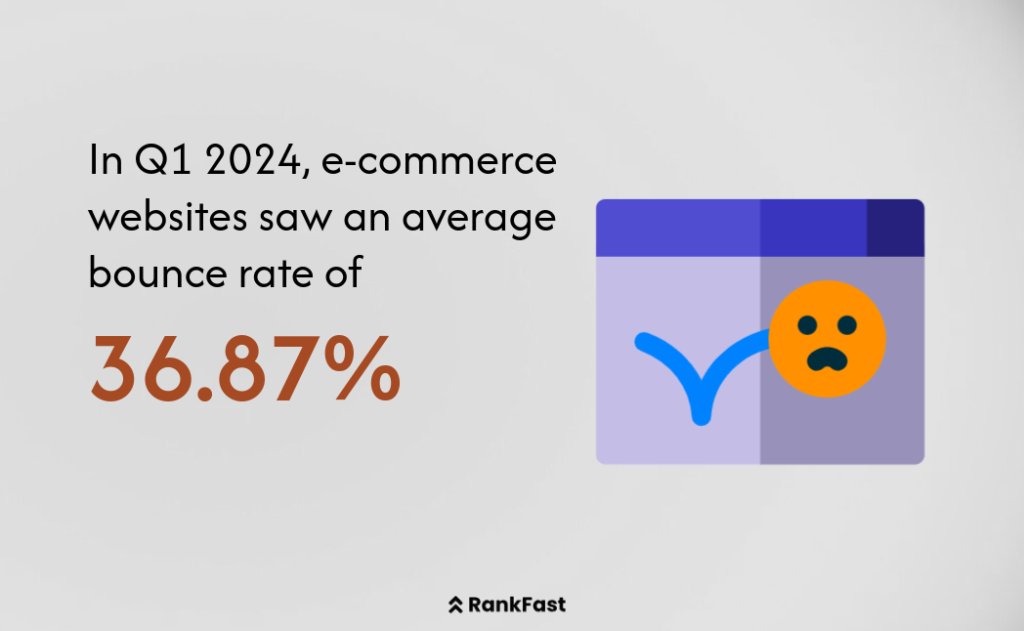
In Q1 2024, e-commerce websites saw an average bounce rate of 36.87%, marking an 18.23% drop compared to the same time in 2023.
To minimize the bounce rate:
- Improve the page load speed.
- Improve website navigation and search functionality.
- Create compelling, relevant content that is mobile-responsive.
10 . Email Marketing Metrics
Email is still one of the most successful mediums for ecommerce. Basic ecommerce metrics to measure in email marketing are:
- Open rates: The open rate is the percentage of receivers who open your emails.
- Click-through rates (CTR): The percentage of receivers that click the links in your emails.
- Conversion rate: The percentage of email recipients that do the requested action.
- List Growth Rate: The rate at which your email list grows.
To enhance email marketing performance:
- Segment your email list for targeted messages.
- Create interesting subject lines and preview text.
- Personalize email content according to customer behavior and preferences.
- Optimize email designs for mobile devices.
11. Shopping Cart Metrics
Understanding how clients interact with your shopping cart can highlight areas for improvement. The key ecommerce metrics include:
- Cart add-to-cart rate: It is the percentage of sessions in which items are added to the cart.
- Cart completion rates: The percentage of carts that lead to a completed transaction.
- Time to buy: Average time from cart creation to purchase completion.
To improve shopping cart performance:
- Implement a persistent cart functionality.
- Provide clear shipping and return information. Offer several payment choices.
- Use progress indicators throughout the checkout process.
12. Average Time on the Site
This metric shows how long visitors normally stay on your website. A longer average stay on site is often associated with increased engagement and conversion rates.
To increase the average duration on-site:
- Create engaging and informative product descriptions.
- Integrate product videos and 360-degree views.
- Offer similar product suggestions.
- Provide interactive elements, such as sizing guides and product configurators.
13. Customer Retention Rate
Customer retention rate refers to the proportion of consumers that continue to purchase from your shop over time. Retaining current clients is often more cost-effective than finding new ones.
Calculation: ((Number of consumers at the end of the period – New customers added during the period) / Number of customers at the beginning of period) x 100
To increase client retention:
- Implement a client loyalty program.
- Offer outstanding post-purchase service and send individualized offers and suggestions.
- Create compelling content that provides value beyond sales.
14. Average Inventory Turnover Rate
This most important ecommerce metric measures how rapidly you sell and replace inventory. A greater turnover rate often implies effective inventory management.
Calculation: Cost of goods sold/average inventory value
To improve inventory turnover:
- Implement data-driven demand forecasting.
- Implement just-in-time inventory processes and provide incentives for slow-moving products.
- Consider dropshipping for certain items.
15. Mobile vs. Desktop Conversion Rate
With the growing popularity of mobile shopping, you need to monitor how your conversion rates change between mobile and desktop visitors.
To increase mobile conversion rates:
- Ensure your site is completely responsive.
- Optimize page loading speed for mobile devices.
- Simplify navigation and search for smaller displays.
- Implement mobile payment solutions such as Apple Pay and Google Pay.
16. Customer Segmentation Metrics
Segmenting your clients based on a variety of characteristics can help you personalize your marketing strategy. Key segmentation most important ecommerce metrics may include:
- Purchase Frequency
- Average order value per section
- Preferred Product Categories
- Customer Acquisition Channel
To use customer segmentation:
- Develop targeted email marketing for certain categories.
- Create tailored product suggestions.
- Tailor marketing for certain client segments.
- Adjust your marketing mix depending on segment results.
17. Social Media Engagement Rates
Tracking engagement rates can help ecommerce firms understand content performance and user interest.

Key Social Media Metrics:
- Engagement rate (likes, comments, and shares per post).
- Click-through rate in social media postings
- Follower Growth Rate
- Social media conversion rate
To increase social media engagement:
- Create visually beautiful and shareable content. Respond quickly to comments and messages.
- Run social media competitions and freebies.
- Utilize user-generated material to foster community.
18. Product Return Rate
While frequently underestimated, product return rates may have a substantial influence on your bottom line and customer happiness.
Calculation: (Number of units returned / Number of units sold) * 100
To lower the return rates:
- Provide accurate and informative product descriptions.
- Utilize high-quality product photos and videos.
- Implement size guidelines and fit suggestions.
- Analyze return causes to discover and resolve frequent difficulties.
19. Website Search Metrics
For shops with a big product inventory, site search capability is critical. Key metrics to measure are:
- Search use rate: The percentage of visitors that utilize site search.
- Search Conversion Rate: Conversion rate for search visitors vs. non-searchers Zero results rate: Percentage of searches with no results.
To optimize the site search:
- Implement autocomplete and search recommendations.
- Include synonyms and frequent misspellings in your search algorithm.
- Offer appropriate filters and sorting choices.
- Analyze popular search phrases to guide product offers and content production.
20. Average Margin
Average margin is the difference between the selling price of a product and its cost, expressed as a percentage of the selling price, showing how much profit a business makes on average for each sale. Understanding your average margin improves profitability and guides pricing choices.
Calculation: (Revenue – Cost of goods sold) / Revenue
To enhance the average margin:
- Negotiate better prices with suppliers.
- Optimize your product mix to prioritize higher-margin goods.
- Implement dynamic pricing techniques.
- Reduce operating expenses via efficiency improvements.
Final Thoughts on Ecommerce Metrics to Track
Tracking these 20 important eCommerce metrics gives you a clear view of how well your store is doing. By regularly checking these key metrics, you can make smart choices based on data. This helps you improve your operations, enhance the customer experience, and support long-term growth.
When you work with Rankfast, you get a complete solution for tracking and improving these key eCommerce metrics. Plus, you’ll receive expert advice and proven strategies for success.
FAQs: Ecommerce Metrics to Track
1. Why use ecommerce metrics to track performance?
Tracking ecommerce analytics helps businesses analyze their performance, identify strengths and limitations, and make data-driven choices. Metrics provide important information about consumer behavior, sales trends, and marketing success. Monitoring these allows you to adjust your methods, boost conversions, lower client acquisition expenses, and eventually increase Revenue.
2. What is the most significant e-commerce measure to monitor?
The most significant ecommerce KPIs vary based on your individual aims. However, the conversion rate is one of the most important since it directly assesses how well your website converts users into paying clients. Other essential measures are customer lifetime value (CLV) and average order value (AOV), which aid in understanding customer profitability and purchasing habits.
3. How frequently should I monitor and evaluate my e-commerce metrics?
Monitor real-time indicators (e.g., traffic, cart abandonment) daily and analyze wider measures like customer lifetime value (CLV) and average order value (AOV) weekly or monthly. Regular analysis allows you to immediately discover patterns and concerns and make appropriate modifications for peak performance.
4. What tools can I use to monitor e-commerce metrics?
Common tools include Google Analytics for traffic and conversions, Shopify Analytics for shop performance, Klaviyo for email analytics, Hotjar for heatmaps, and SEMrush or Ahrefs for SEO analysis. These tools provide useful information for effectively optimizing e-commerce strategies.
Leave a Reply